Introduction
Did you ever ask yourself if all existing aggregate functions are always working the same way no matter the data quantity you have for a given period ? I would say « it depend of the need » but in a perfect world it always simplest to fill the gap for missing data in SQL queries results.
Be aware that I also wanted to simplify this official Oracle post according to my personal experience and introducing this concept to get a better understanding of my next post about windowing aggregation and how I avoid useless loop on data.
Why simplest ?
Because data remains immutable and most important clear in your head for SQL queries you have to develop. I saw plenty queries not very consistent about execution plan and retrieving incomplete data dimension. Data are in fact sparse with no regular density and then difficult to format or render.
Increasing data volume ?
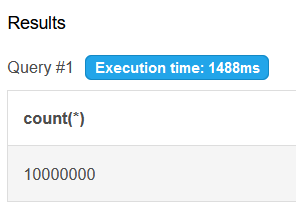
Sure, data volume is already big but adding extra generated lines have no cost for the database as these lines are not existing physically. To demonstrate this point, just launch this simple query to simulate a Cartesian product generating 10M lines using a simple « cross join » clause.
-- **Schema (MySQL v8.0)**

    with cartesian as (
    select 1 as number union select 2
    union select 3 union select 4
    union select 5 union select 6
    union select 7 union select 8
    union select 9 union select 10 )

    select count(*) from cartesian c
    cross join cartesian c1
    cross join cartesian c2
    cross join cartesian c3
    cross join cartesian c4
    cross join cartesian c5
    cross join cartesian c6;
10 millions lines generated in 1.5 sec, you can try and check with a SQL fiddle sandbox here
A simple customer need
Let see with an simple example how is it important, so business came next to you for sales reporting, the need is basic, for the last year they need :
- Average sales amount
- Number of sales period (even during covid pandemic)
- Total sales amount
- The minimum sales figure
No datawarehouse !
This need is such a piece of cake that you don’t even realize there is no available data warehouse with the famous and universal timetable 😉
Let’s see how to manage this by looking the sale stable content.
with sales as
(
select '2021' as year, 1 as month, 10 as amt
union select '2021' as year, 5, 10
union select '2021' as year, 12, 10
)
select * from sales| year | month | amount |
| 2021 | 1 | 10 |
| 2021 | 5 | 10 |
| 2021 | 12 | 10 |
Let’s write the query for our dear fellow business team
with sales as
(
select '2022' as year, 1 as month, 10 as amt
union select '2022', 5, 10
union select '2022', 12, 10
)

select 'cpt' as AGG, count(amt) as AMT from sales group by year
union select 'avg', avg(amt) from sales group by year
union select 'sum', sum(amt) from sales group by year
union select 'min', min(amt) from sales group by year| agg | amt |
|---|---|
| cpt | 3.0000 |
| avg | 10.0000 |
| sum | 30.0000 |
| min | 10.0000 |
Introduce the results
You’re confident with this result but… wait… something goes wrong with business team, it seems that figures are not the result they were expecting for. Indeed, after a shot brainstorming, the shop remains open during covid pandemic but no customer came due to quarantine, we have to keep count of the inactivity sales period.
Solution
Let’s create a temporary timetable using a other with clause then we use a left join to fill the gap, I also re-query and compare the original column AMT I renamed SPARSE with a new column NEW_AMT.
with timetable as
(
select '2021' as year, 1 as month union select '2021',2
union select '2021',3 union select '2021',4
union select '2021',5 union select '2021',6
union select '2021',7 union select '2021',8
union select '2021',9 union select '2021',10
union select '2021',11 union select '2021',12
),
sales as
(
select '2021' as year, 1 as month, 10 as amt
union select '2021' as year, 5, 10
union select '2021' as year, 12, 10
),

t1 as
(
select
timetable.year, timetable.month,
sales.amt as sparse, coalesce(sales.amt,0) as new_amt
from timetable
left join sales on sales.month = timetable.month
)

select 'cpt' as AGG, count(sparse) as SPARSE, count(new_amt) as NEW_AMT from t1 group by year
union select 'avg' as agg, avg(sparse) , avg(new_amt) from t1 group by year
union select 'sum' as agg, sum(sparse), sum(new_amt)  from t1 group by year
union select 'min' as agg, min(sparse) , min(new_amt) from t1 group by year| AGG | SPARSE | NEW_AMT |
|---|---|---|
| cpt | 3.0000 | 12.0000 |
| avg | 10.0000 | 2.5000 |
| sum | 30.0000 | 30.0000 |
| min | 10.0000 | 0.0000 |
Test again the above example here, we directly see the correct figure versus old bad results, only the sum aggregation remains correct.
Conclusion
Filling missing data is a good starting point for miscellaneous aggregation by getting a immutable data set we can query, this tip is especially useful for windowing aggregation BI approach I’ll explain in a future post… stay tune 😉


Commentaires récents