Introduction
I recently ran into Dataiku Data Science Studio in my last mission and unfortunately didn’t have the opportunity to get my hands on this tool. After a quick search Dataiku can be install with a free license for demo purpose.
The official github repository host a Dockerfile we can use to install Dataiku at lightning speed but lacks some important parts and won’t help you to customize everything:
- First of all, it seems not to be maintained anymore and stuck to version 11.2.0 and we can see here, the last version is 12.6.0 from… 2 weeks ago 😀
- No compose file to easily orchestrate services
- At first glance no data are provided, you need to import sample data manually
- You have to launch cryptic docker command to build and instantiate images
- Fine tune your own host file
So I decided to fork this repository and add these new features:
- Dockerfile full refactoring to update the binaries and use docker best practices
- Add a compose file using profile to use either Oracle or Postgres database
- Add a 1 million customers sample automatically injected at startup as a simple view
- For previous point, Postgres image has been extended with postgressql-contrib and its analytical functions
- Script to get the drivers
- Add traefik service for edge proxying the tool and use localtest.me as DNS name
WARNING: Pay attention that Dataiku can be connected to Oracle only with a license, Postgres and MySQL are both available with free license.
Get the repository
Download the github repository with the following command:
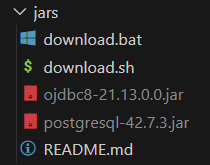
git clone https://github.com/jsminet/docker-dataiku.gitOnce the repository is on your local disk, download the database drivers libraries in the jars directory using the download.sh/.bat script depends of your operating system.
Build and launch the services
Before launching the complete stack, you must install docker compose version 2 then build docker Dataiku + Postgres (with contrib images) using this command:
docker compose --profile postgres buildBe patient, Dataiku docker image is really heavy, once done launch this command to run in background and follow the dataiku startup progress:
docker compose --profile postgres up -d && docker compose logs -f dataikuIt takes some extra times, Dataiku need to be installed at first launch, it won’t be the case if you restart the container.
Dataiku access
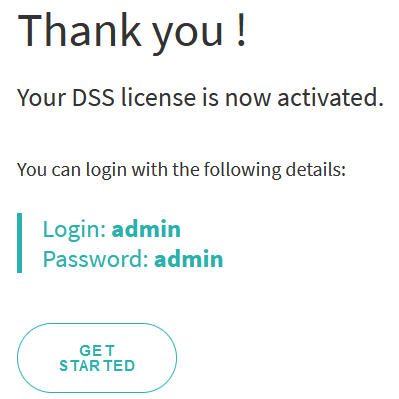
Open your favorite browser and go to http://dataiku.localtest.me then select the free license and enter your optional personal data, then click on next, Dataiku give you the first credential you have to use.
Create a connection
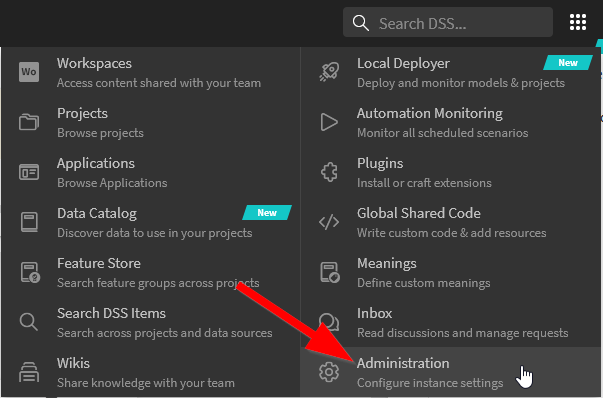
Once connected with admin / admin credential, go to the top right principal menu and choose Administration
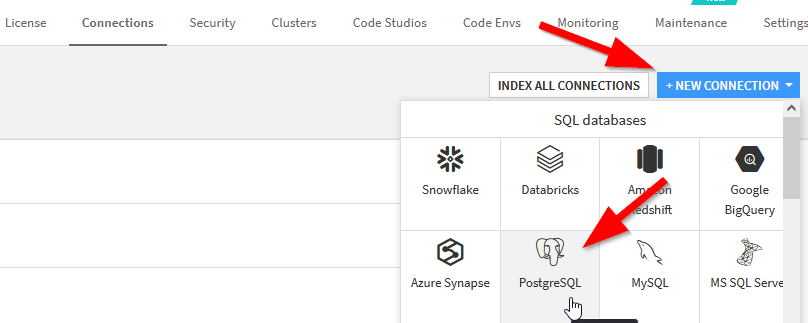
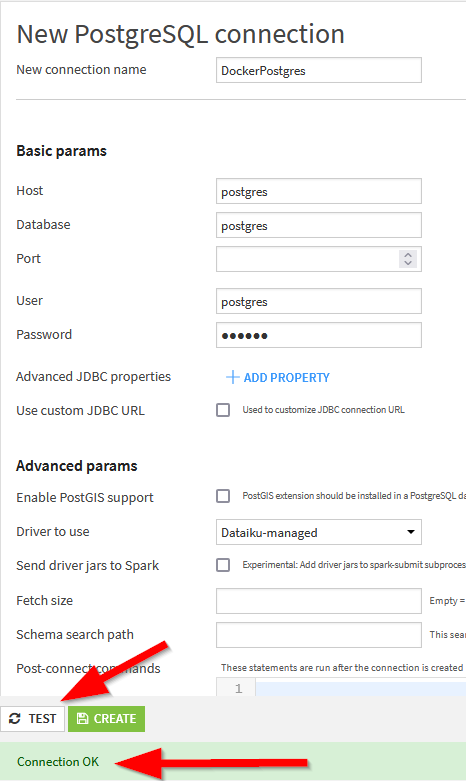
Create a brand new Postgres connection
Use these credentials coming from the compose .env file that contains all the environment variables.
| Host | Database | Port | User | Password |
| postgres | postgres | blank default or 5432 | postgres | secret |
Test first the connection then click on create to save it.
Create a project
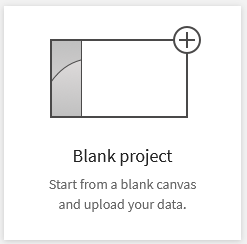
We are now ready to create a project, back to the home page click on blank project
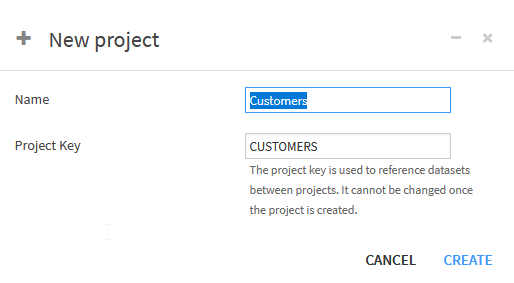
Give a name to your project
Create a dataset
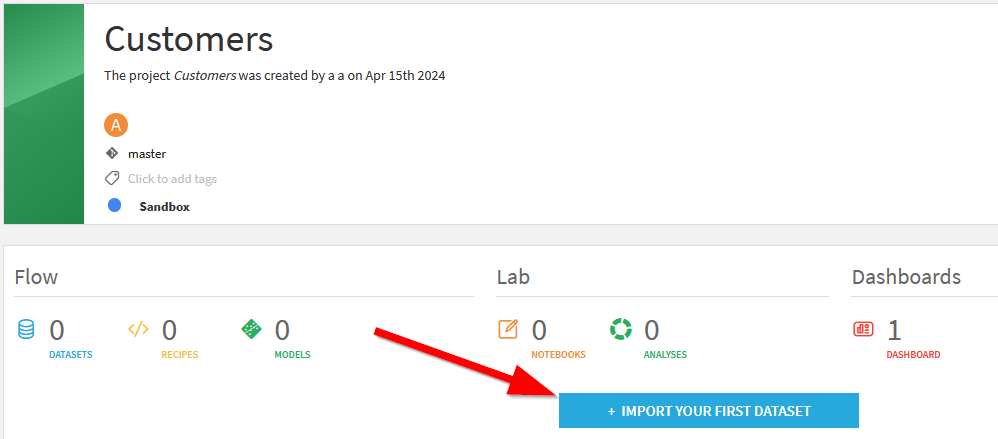
And import your first dataset coming from the Postgres bundled view
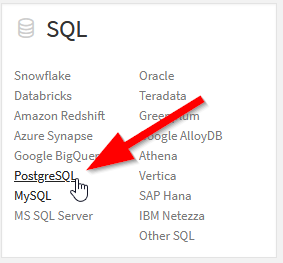
Choose PostgreSQL, others choice are grey due to the free version
Get the tables list, you can ignore the warning, there is only one view 😉
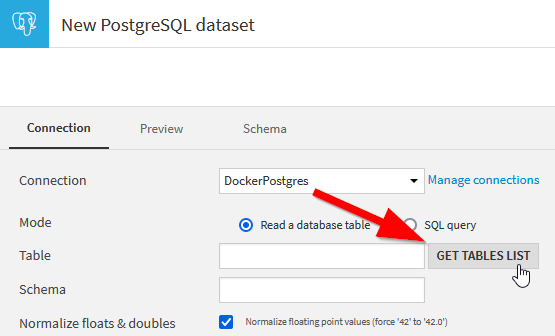
Choose the vw_customers view

Test the table access

Check also the data preview to see if metadata’s are correctly inferred.
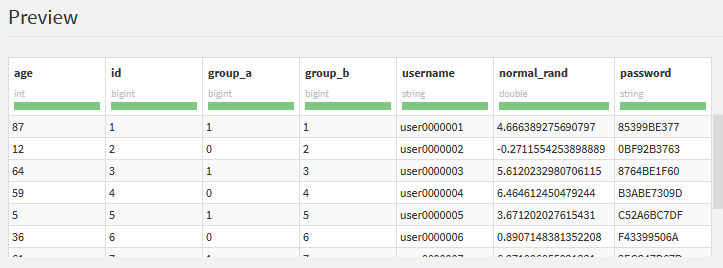
Click on create the dataset is now ready to explore
Create your first report
You can explore the data in table way but the most interesting feature is the second tab named Charts.

As a first try, you can choose the Lines chart and show the normal_rand by username
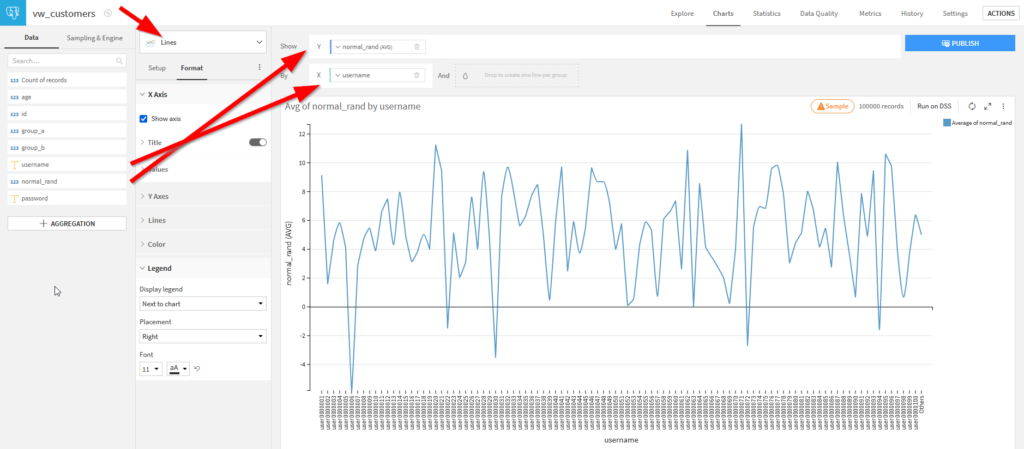
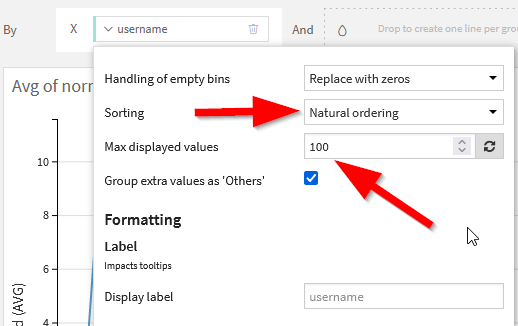
Edit the field username by clicking on the arrow and sort in natural order and let’s display 100 values
Add another chart by clicking on + Chart

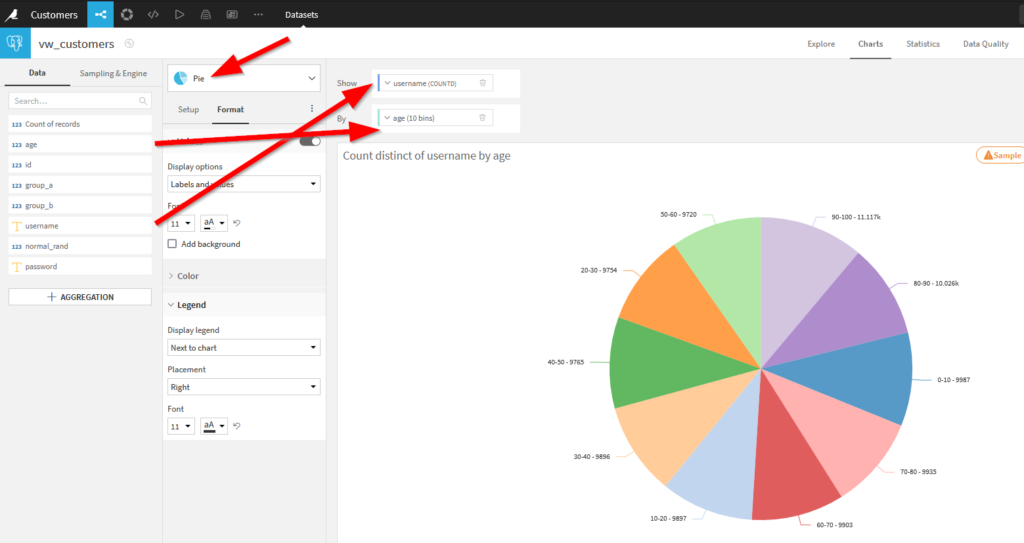
Let’s add a Pie chart, show the username (distinct count) by age
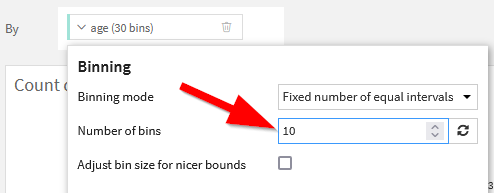
To see the number of user by 10 years range, edit the Age field and set number of bins to 10.
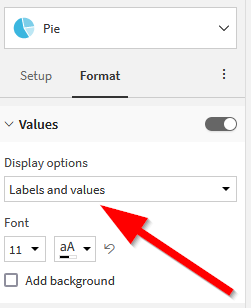
In the format tab select Labels and values to display more information.
Publishing the report
The publish button on top right screen allow you to create a dashboard to consolidate all your reports

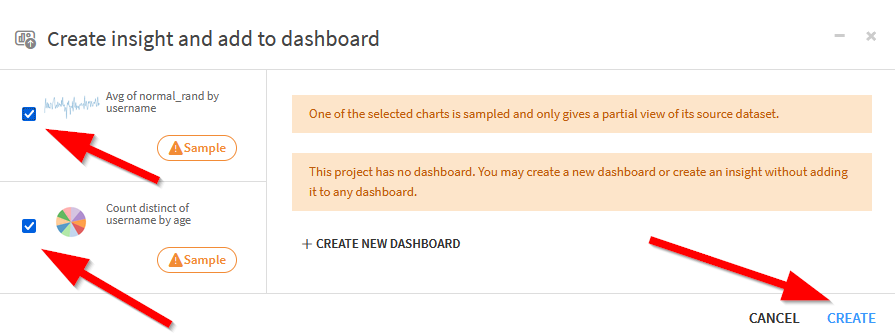
Select all the report you need in your dashboard then click on create
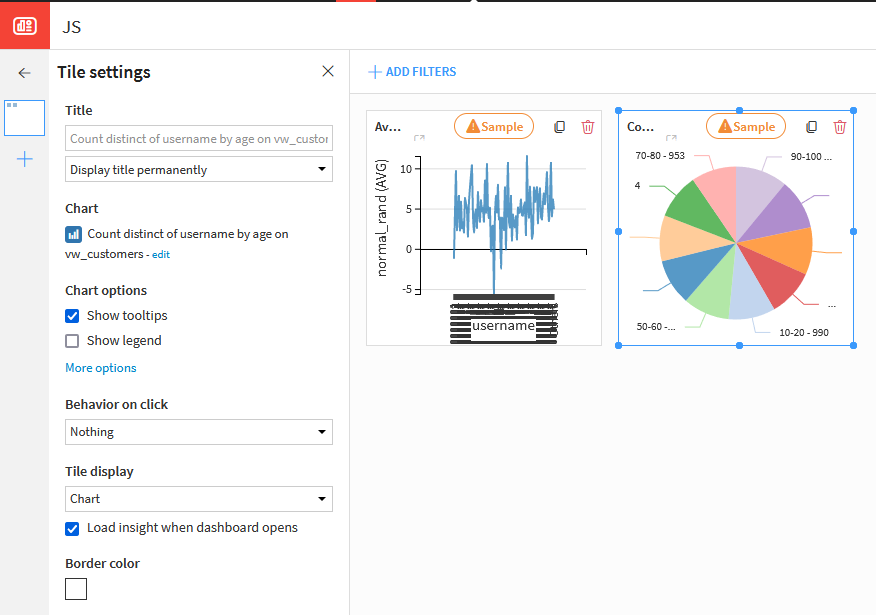
Furthers features
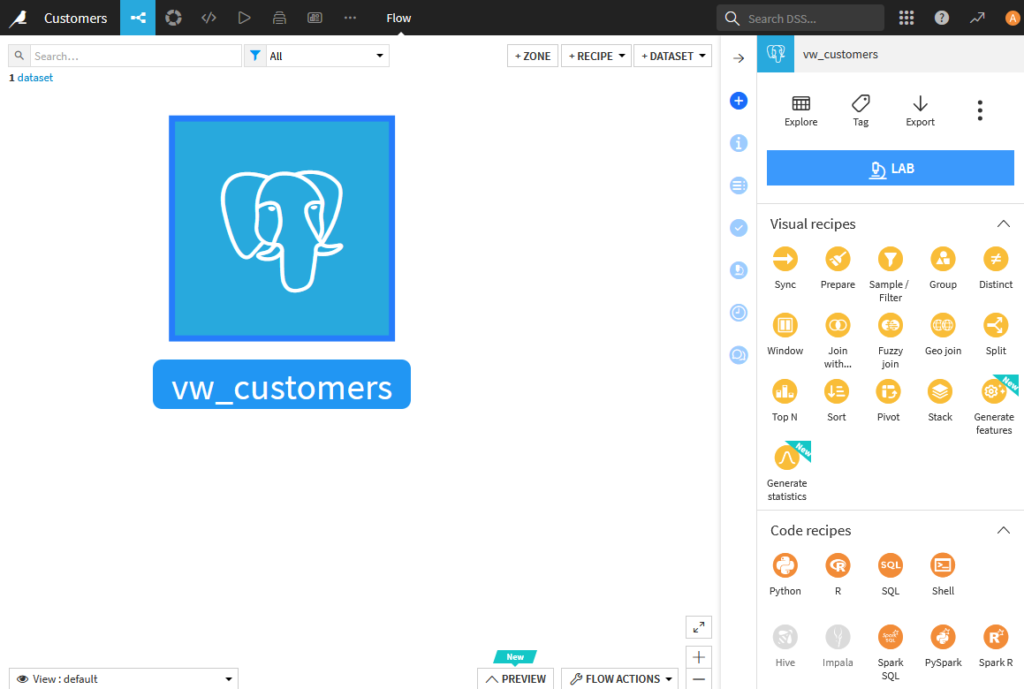
Dataiku also acts as a ETL, you can also create flow… and many more:
Conclusion
Just to be clear, we have seen the tip of the iceberg, Dataiku have so many features and seems to be an extreme powerful BI tool. As I can’t describe everything here don’t hesitate to post a comment for next posts 😉


Commentaires récents